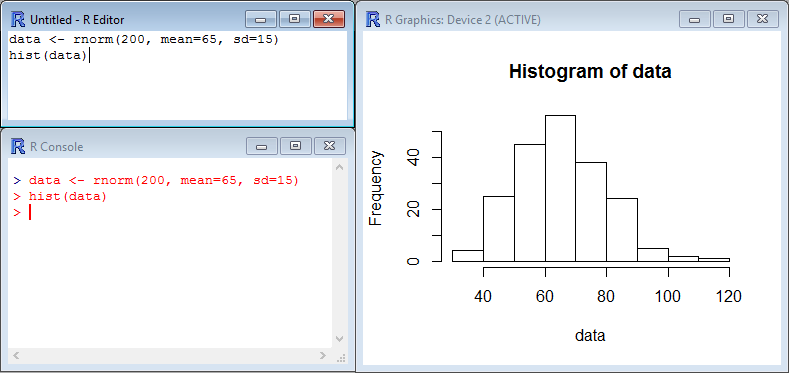
The function hist() is a very simple function which does not require much to build a histogram of frequency (representing the distribution of data series) based on the content of a vector. Simply typing hist(z), for example, creates a histogram of the vector z made of 10 bars (by default).
Let’s try it on the vector data. For the purpose of this example, we’ll create a random series of 200 values, with a mean of 65 and a SD of 15 using rnorm() (by the way, those values are normally distributed…):
[code language=”r”]
data <- rnorm(200, mean=65, sd=15)
hist(data)
[/code]
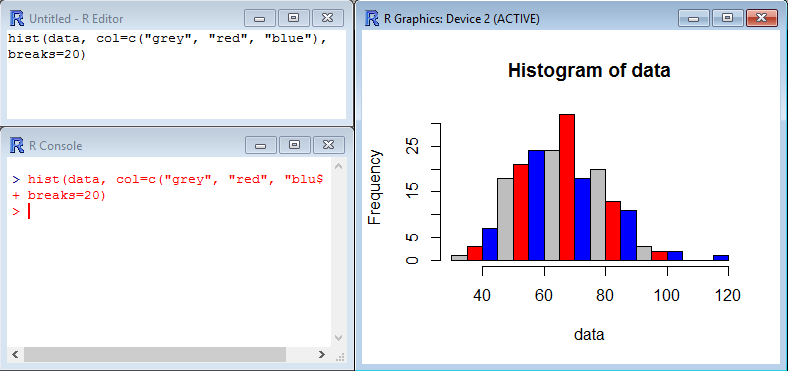
Adding simple arguments such as col= and breaks= change the look of the histogram by adding colors to the bars and changing the number of bars in the graph.
[code language=”r”]
hist(data, col=c("grey", "red", "blue"),
breaks=20)
[/code]