
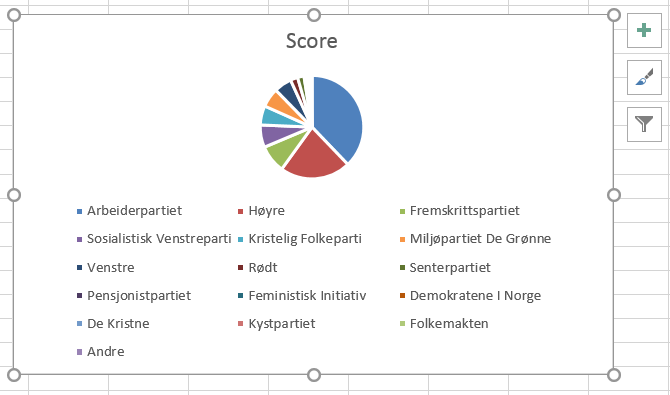
 You may realize, looking at the pie chart that we just made previously, that the design of the chart area is rather inadequate. The chart itself is ridiculously small compared to the legend. This is essentially due to a default setting that MS Excel uses and which restricts the size/position of the legend box. To display the graph more efficiently, you simply need to move the legend box.
C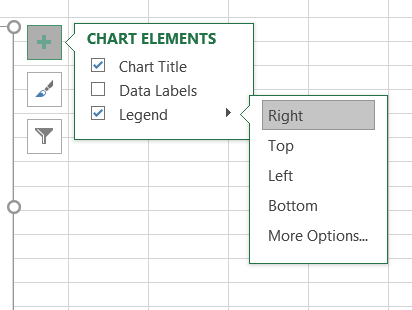 lick on the icon
 + to the right of the chart area, then on the arrow next to Legend and finally select Right. The legend moves to the right of your chart which occupies now a larger part of the chart area. Note that the legend does not display all parties yet. You must use the mouse to resize the legend box and give enough space for all items to appear.
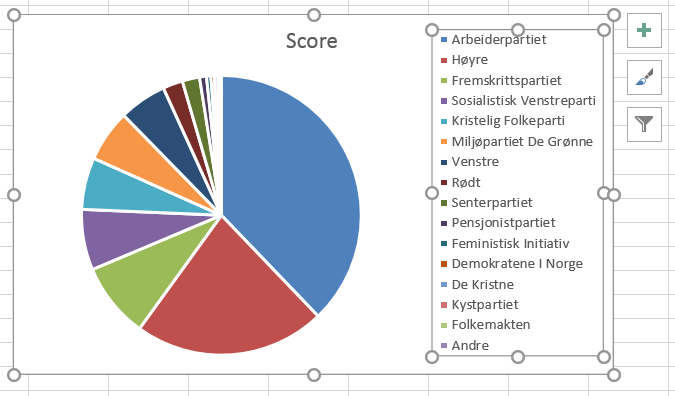 Select the legend box by clicking once over the legend area. A frame with 8 “handles” appears. Click on any of these handles, then hold and drag to resize the box until all labels are visible.
This applies to all chart types, not only the pie chart. Not also that you may modify further the appearance of the legend box and labels (colors, background, borders, size…) and some properties of the series (colors, pattern…) by clicking directly on the different objects in the legend.