
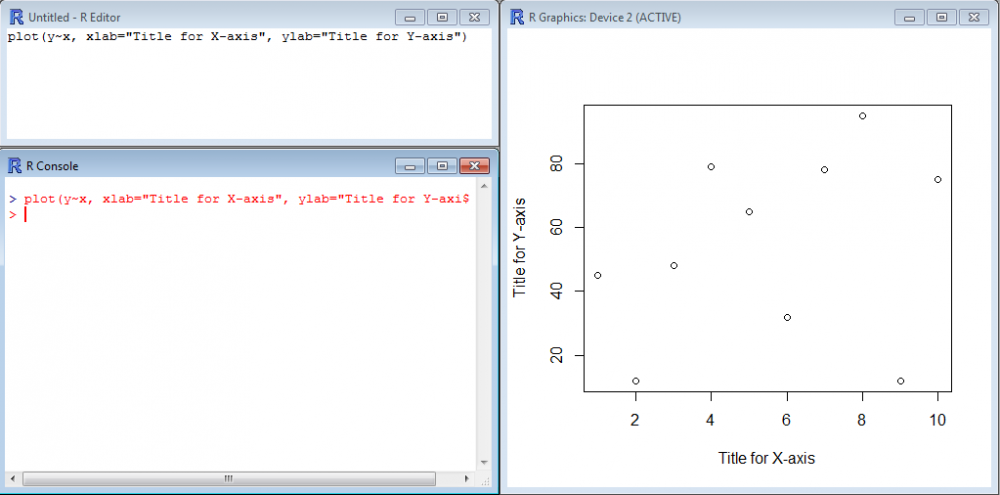
The command plot() may contain several lines of code to tune the display and make the plot more “readable”. For instance, it may be useful to add labels to the Y-axis and X-axis. The arguments to be used are xlab= and ylab= as shown here:
[code language=”r”]
plot(y~x, xlab="Title for X-axis", ylab="Title for Y-axis")
[/code]
Fant du det du lette etter? Did you find this helpful?
[Average: 0]