
Often you will have (or feel) the need to create a table to display your data. Tables are useful when your data are defined by categories or labels. However, large tables with many rows and/or columns may easily become difficult to read unless you use borders and colors appropriately. Most of the tools you need are located in the ribbon, more precisely in the Font section of the Home tab.
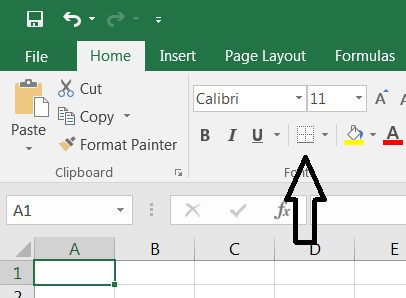 Lets start with borders. The first picture to the right shows where to find the menu required to add borders. The tiny arrow to the right side of the border icon gives you access to a menu where you can choose between many types of borders (top, bottom, left, right, double, thick and more). When you’ve select the type you like, simply press on the icon to apply it to the selected cells or areas. Watch how it’s done here.
 Choosing and using colors is just as simple. Check the second picture to the right to locate the icon. Again, the tiny arrow to the right of the icon allows you to choose between many options (you may pick a color among a palette of preset colors or choose to precisely define it via
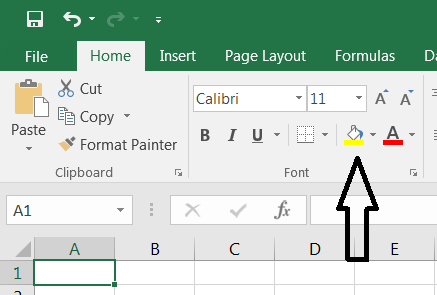
 More colors...). Once the color chosen, click on the bucket icon to fill in all the select cells. The same goes for the A icon which allows to pick a color for the content (text, numerical values) of the cell. Watch a video here.
Using both borders and colors, you will be able to design a simple or complex table which will not only look nice (providing that you have good taste for colors), but also make it easy for the reader to find and understand your data.
 In addition to adding borders and tools, MS Excel has a function which can create a table with headers including the tools to sort your data. In the section
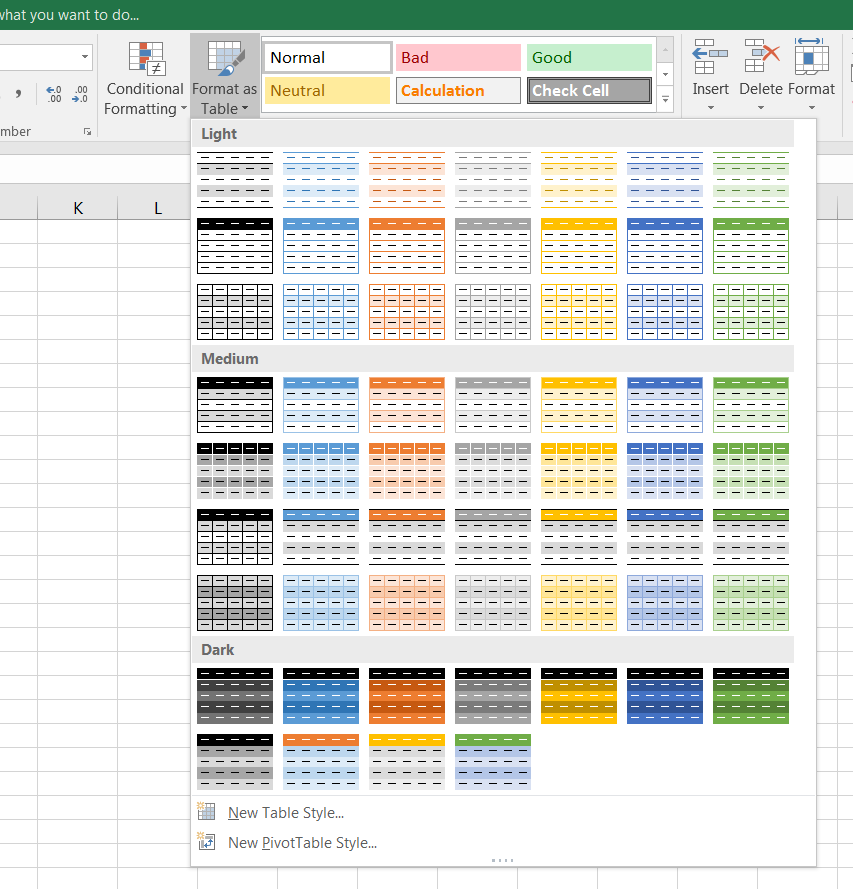
 Styles of the Home tab, the button Format as Table allows you to create a colored table with additional functionalities in a few clicks. Select your table with the mouse, click on Format as Table, click on a color scheme, confirm the range of cells which will host the table and tick the box if your selection contains headers before clicking OK. Borders and colors are now visible and a button in the header cell allows you to sort the whole table according to the parameters of your choice. Watch a video here.