When you start playing with the size of the labels and titles, you quickly realize that the frame of the plot becomes too small. It is time to introduce the argument par(mar=c(B,L,T,R)) where B, L, T and R stand for bottom, left, top and right, respectively. Of course you will have to replace B, L, T and R by number which indicate the size of the margins in terms of “number of lines of text”. If this sounds a bit weird, you may use par(mai=c(B,L,T,R)) which does the same job, but the numbers will indicate the size of the margins in inches. Here are three copies of the same plot. The top left plot is surrounded by margins designed with par(mar=c(8,8,8,8)), the top right plot with par(mar=c(5,5,5,5) and the bottom left one with par(mar=c(3,3,3,3)).
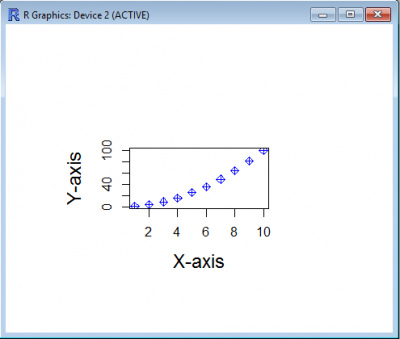
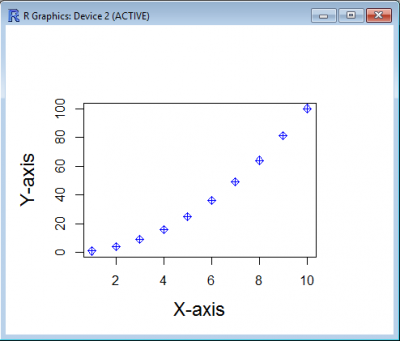
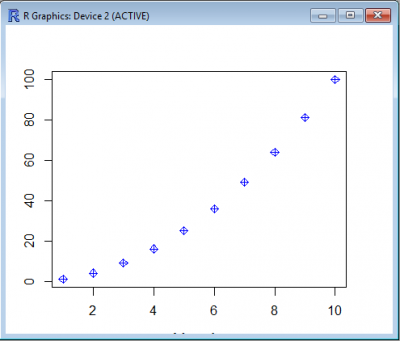
In this example, it is clear that using 8 lines of text for margins is excessive. Using only 3 does not leave enough space for the labels which are cut away from the chart. Thus the solution in the top right corner is the best of these three examples.
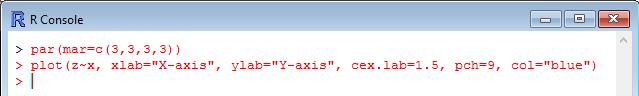
Note that par(mar=c(B,L,T,R)) must be entered prior to typing the command creating the plot with plot(). The following picture illustrates the sequence of commands: