
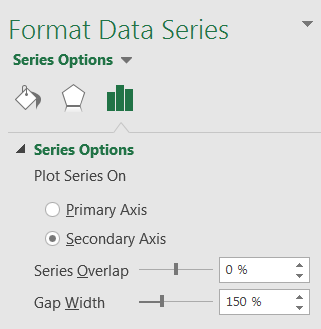
 Here, our goal is to keep using the left Y-axis for the temperature chart, while we set up a new (secondary) Y-axis to the right side of the graph that will be dedicated to the rain chart. Right-click directly on the rain data series in the plot area to open the contextual menu and choose
 Format Data Series.... In the right menu (see picture), under Series Options, click on Secondary Axis and validate with OK.
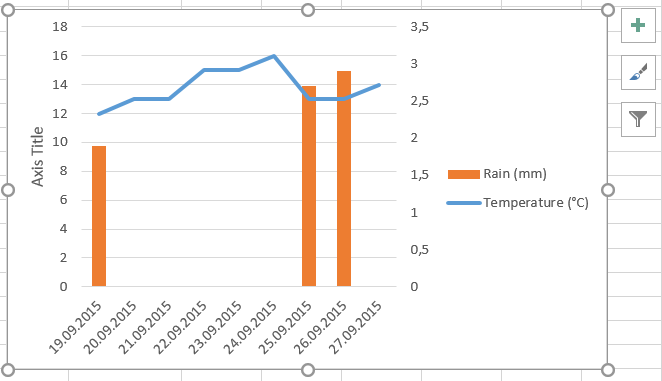 Instantaneously, the secondary Y-axis is displayed and the data series corresponding to rain values is rescaled, which makes the data much clearer.
Note that the option Gap Width in the menu below defines the width between the bars of the graph, which means that you can set up how large the bars will look like. This helps a lot in terms of clarity.