
There is a way to obtain most, if not all, of the values detailed above in this page by using a tool package in MS Excel. This tool package is called “Analysis Toolpak” and provides the mean, standard error, median, standard deviation, sample variance, range, minimum, maximum, sum, count and more. This package however needs to be installed or activated before it is available in the ribbon of MS Excel 2010.
How to get it?
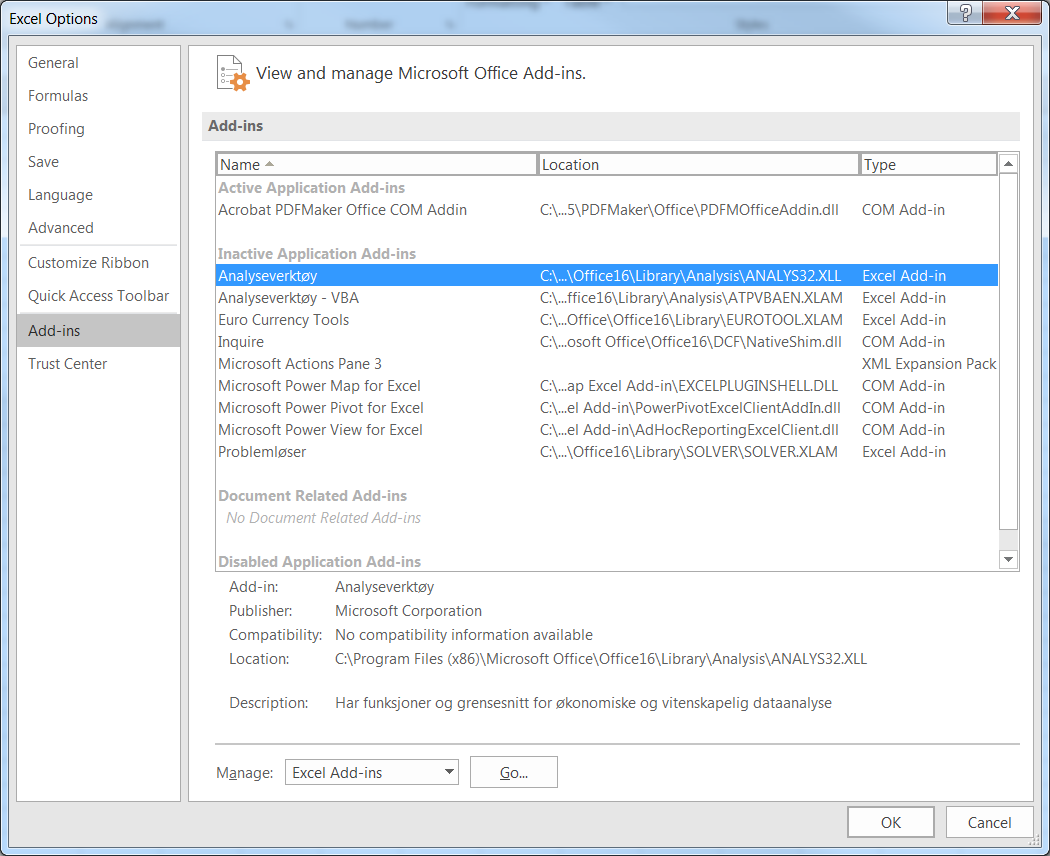 This package is part of the MS Office pack which is available at UiB and which is often found in the version of MS Office that most people have on their machine (without even knowing it). To activate it, click on the
 File tab in the menu bar, and choose Options. Then, select Add-Ins, and in the list of Add-Ins, choose Analysis ToolPak (Analyseverktøy in the Norwegian version). Finally, next to Manage: at the bottom of the screen, select Excel Add-Ins and click Go....
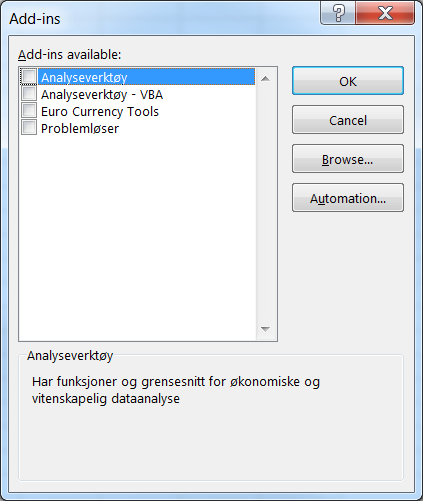 A new dialog box shows up and gives you the possibility to install several packages. Here, you’ll just have to tick the first option
 Analysis ToolPak (Analyseverktøy)and click OK.
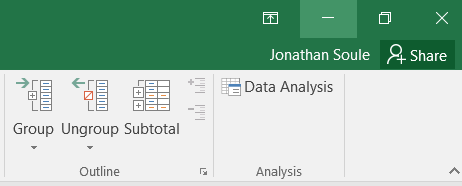 From that moment, the ribbon under the
 Data tab contains a new section called Analysis and in which you will find the Data Analysis icon. This is the tool you need in order to obtain most of the descriptive stats. Click on it to open the dialog box called Data Analysis. A list of options shows you all the possibilities offered by this package. Simply select Descriptive Statistics and click OK.
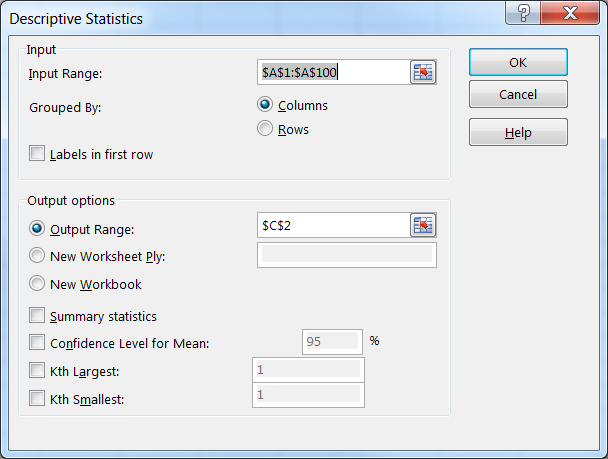 In the field
 Input Range, enter the range of cells containing the dataset. In our example, write “A1:A100”. In Output Options, choose where you want to display the summary. With Output Range, you may indicate a place (cell address or range) in the current worksheet where the final table will be placed. With New Worksheet Ply, the summary will be placed in a separate worksheet; that worksheet will be named after the content of the field to the right. With New Workbook, a new Excel file/workbook will be opened and will host your summary.
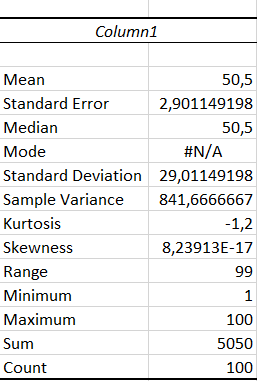 Finally, the last four boxes allow you to choose the content of the summary. At least one of these boxes must be checked. Here, we’ll just tick the
 Summary statistics box. Click on OK to validate your choices.