
Not only can the text/labels of the axes be tuned, but also the lines, colors, annotations, ticks… The function axis() may be used with various parameters such as col (for the colors), tck (for the length of the ticks), at (for using a vector to indicate the position of the ticks), labels (to use a text vector to substitute the labels next to the ticks), pos (the position where it crosses on the other axis), lty (for defining the line type, see tuning lines)… One important parameter in axis() is side which define with a number from 1 to 4 which axis will be affected by your command. Use 1, 2, 3 and 4 for bottom, left, top and right, respectively. In the following example, we see how to modify the bottom axis.
[code language=”r”]
x <- c(1,2,3,4,5,6,7,8,9,10)
z <- c(1,4,9,16,25,36,49,64,81,100)
plot(z~x, axes=FALSE)
axis(1, col="blue", tck=0.02, at=c(1:10), pos=50, lty=5)
axis(2, col="red", tck=0.02, at=seq(0,100,10),
labels=c("0","","20","","40","","60","","80","","100"),
pos=0, lty=1)
[/code]
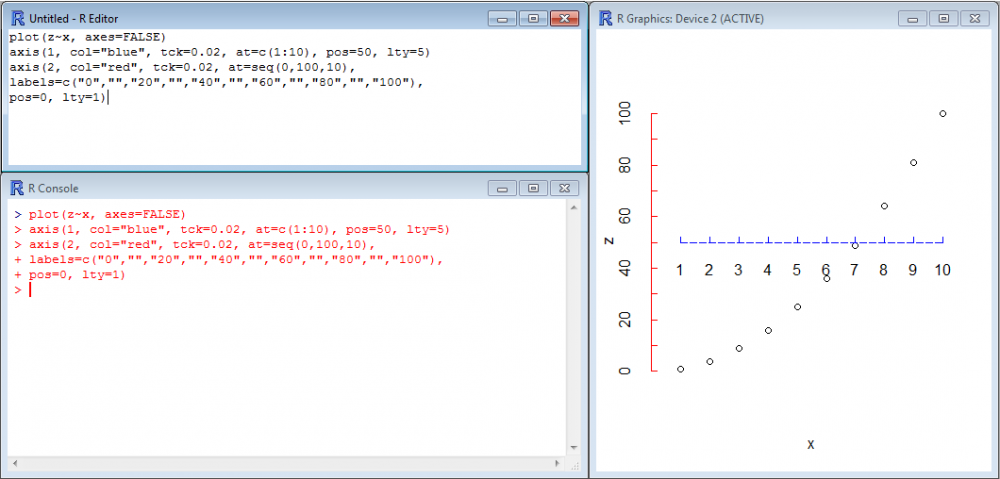
Here are some necessary explanations about the example above. First, in the function plot(), the argument axes=FALSE was added in order to remove the default axes provided by plot(). If this argument had been missing, the axes created by axis() would have been printed on top of the default axes (same as for the labels, see adding titles and labels).
Then, you see that the position of the ticks on the X-axis has been defined by the series c(1:10) and that the labels (1,2,3…10) came automatically. For the Y-axis, the position was defined by seq(1,100,10) but the labels had to been defined by a text vector added to labels= for increasing aesthetics. Try the same code without the argument labels to understand why.