
 A boxplot (box plot, or whisker plot) is a compact, but efficient way to represent a dataset using descriptive stats. This “little diagram” combines informative, standard values such as the first and third quartiles (the bottom and top of the box, respectively), the median (the flat line inside the box) and sometimes the mean (a second flat line inside the box). The whiskers are often used to represent the minimum and maximum values, but some use other parameters such as: one standard deviation above and below the mean of the data OR the lowest and highest values contained in the range defined by the 1st quartile minus 1,5 times the interquartile range and the 3rd quartile plus 1,5 times the interquartile range (cf. “Tukey plot”) OR the 5th and 95th percentiles, etc. Anyway, because the whiskers are defined by the user (and not by convention), it is important, when creating the boxplot, to mention what they represent in the legend of the chart.
 To draw a boxplot, select your range of data (A1:A100), then go to the tab
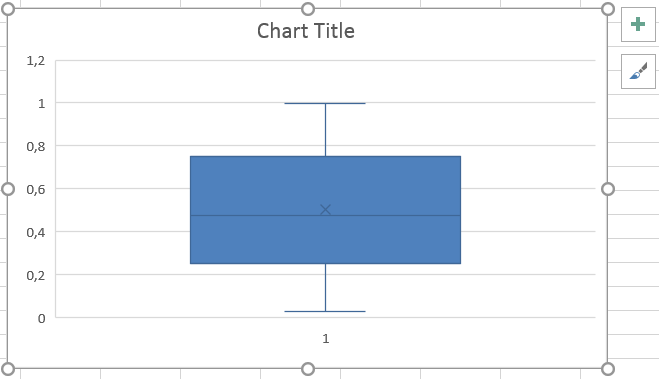
 Insert, find the icon Insert Column or Bar Chart and select More Column Charts... In the long list of charts in the tab All Charts, click on Box & Whisker and OK. The following chart appears.
As you can see, the chart is pretty much ready to use. Right-clicking on the box and choosing Format Data Series..., you will be able to decide via the menu to the right whether outliers, data points, etc are to be displayed.